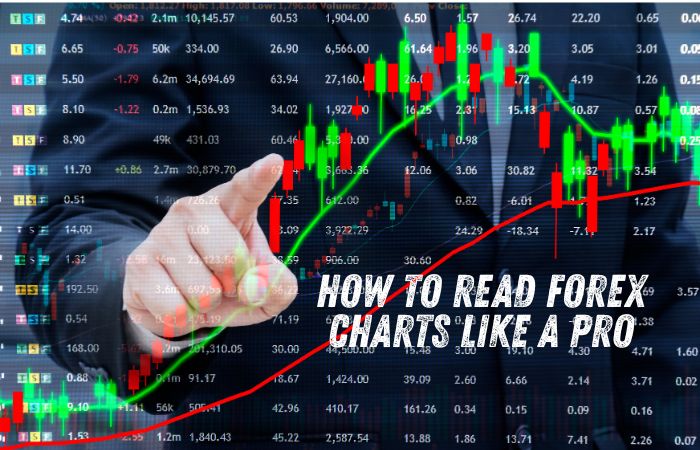
Traders often say that “charts tell the story.” Whether you are just starting out or already experimenting with strategies, learning to interpret forex charts can be the difference between guessing and making informed decisions.
At first glance, these charts may seem overwhelming with their lines, candles, and indicators. However, once you understand their language, they become a powerful tool that can guide your trading journey.
Forex charts are essentially the roadmap of market behaviour. They don’t just show price movements; they reveal patterns, momentum, and potential opportunities. By mastering chart reading, you give yourself the ability to anticipate rather than simply react to market moves. Let’s explore how to approach forex charts like a professional, breaking down their components and highlighting practical strategies to use them effectively. For more update please visit our website.
The Foundation: Understanding What You’re Looking At
Before diving into candles and indicators, it’s essential to ground yourself in the basics of forex trading. If you’re new, you might first want to explore what is forex trading to understand how currencies are bought and sold in pairs. Once that foundation is set, charts become much easier to interpret.
A forex chart is a visual representation of price movement over time. On one axis, you’ll see the currency pair’s price, and on the other, the time intervals. By analysing these visuals, traders can identify trends, support and resistance levels, and areas where the price may be likely to move next.
Types of Forex Charts
Forex platforms generally offer three main chart types, each useful for different styles of analysis. Line charts are the most straightforward, connecting closing prices across a set time frame. They are particularly helpful for beginners or for traders who want a clear, uncluttered view of overall trends. Bar charts add more detail by displaying the open, high, low, and close (OHLC) for each time period. They provide deeper insights into price movement within that interval.
Candlestick charts, however, are the most popular choice among traders. Like bar charts, they show OHLC data, but their design is more visual and easier to interpret. A green or white candle usually represents upward movement, while a red or black candle indicates downward movement. Candlestick patterns can also reveal shifts in market sentiment, which makes them essential for short-term analysis.
Spotting Trends Like a Pro
Trends form the backbone of forex trading. Recognising whether a currency pair is moving up, down, or sideways allows you to align your trades with the prevailing market direction. Professionals often repeat the phrase, “The trend is your friend,” because trading with the broader trend generally increases the probability of success.
An uptrend is characterised by a series of higher highs and higher lows. A downtrend is marked by lower highs and lower lows. When the price moves within a narrow range without a clear direction, it is considered a sideways trend or consolidation.
Traders often use trendlines, drawn on charts to connect significant highs or lows, to confirm the trend visually. Moving averages, such as simple moving averages (SMAs) or exponential moving averages (EMAs), are also widely used to smooth out market noise and make trends easier to identify.
Support and Resistance Levels
Support and resistance levels act as invisible boundaries on a chart. Support is a level where buying interest is strong enough to prevent the price from falling further, while resistance is a point where selling pressure usually stops upward movement.
When these levels are identified, traders gain valuable insight into where the price may pause, reverse, or break through. For example, if the EUR/USD pair repeatedly rebounds from the 1.0800 mark, it suggests that level is acting as support. On the other hand, if the pair struggles to rise above 1.1000, that price zone is functioning as resistance. Professionals use these levels strategically when planning trade entries, exits, or setting stop-loss orders.
The Power of Candlestick Patterns
Candlestick charts offer more than just visual appeal. They reveal market psychology and potential turning points. Patterns such as doji, engulfing, hammer, and shooting star often indicate reversals or continuations. A hammer, for instance, appearing at the bottom of a downtrend, suggests buyers are beginning to push back, potentially reversing the decline. Conversely, a bearish engulfing pattern at the top of an uptrend suggests sellers are taking control, which may lead to a downward shift.
These patterns are most effective when combined with other forms of analysis, such as trendlines and support or resistance levels. Used in isolation, they can be misleading, but in context, they strengthen confidence in trading decisions.
Conclusion
At first, forex charts can feel like a code only seasoned traders can decipher. Yet, once you grasp the fundamentals—different chart types, trends, candlestick patterns, support and resistance, and technical indicators—they evolve into a trusted guide. Reading charts like a pro is not about perfection but about building clarity and confidence in your decisions.
The skill develops through patience, consistent observation, and a willingness to learn from both wins and losses. In time, you’ll come to see forex charts not as a source of confusion but as a window into opportunity. By interpreting them with strategy and foresight, you empower yourself to navigate the markets with confidence and poise, steadily moving closer to your trading goals.